|
700
|
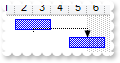
How can I change the shape of the task bar

With G2antt1
	With .Chart.Bars.Copy("Task","T2")
		.StartShape = 2
		.StartColor = RGB(255,0,0)
	End With
	.Chart.FirstVisibleDate = #1/1/2001#
	.Columns.Add "Column"
	With .Items
		.AddBar .AddItem("Item 1"),"T2",#1/2/2001#,#1/4/2001#
		.AddBar .AddItem("Item 2"),"Task",#1/2/2001#,#1/4/2001#
	End With
End With
|
|
699
|
How can I change the starting shape for all task bars

With G2antt1
	With .Chart.Bars.Item("Task")
		.StartShape = 1
		.StartColor = RGB(255,0,0)
	End With
	.Chart.FirstVisibleDate = #1/1/2001#
	.Columns.Add "Column"
	With .Items
		.AddBar .AddItem("Item 1"),"Task",#1/2/2001#,#1/4/2001#
	End With
End With
|
|
698
|
How can I change the height of the task bar

With G2antt1
	.Chart.Bars.Copy("Task","T2").Height = 17
	.Chart.FirstVisibleDate = #1/1/2001#
	.Columns.Add "Column"
	With .Items
		.AddBar .AddItem("Item 1"),"T2",#1/2/2001#,#1/4/2001#
		.AddBar .AddItem("Item 2"),"Task",#1/2/2001#,#1/4/2001#
	End With
End With
|
|
697
|
How can I change the height for all task bars

With G2antt1
	.Chart.Bars.Item("Task").Height = 17
	.Chart.FirstVisibleDate = #1/1/2001#
	.Columns.Add "Column"
	With .Items
		.AddBar .AddItem("Item 1"),"Task",#1/2/2001#,#1/4/2001#
	End With
End With
|
|
696
|
How can I change the color of the task bar

With G2antt1
	.Chart.Bars.Copy("Task","T2").Color = RGB(255,0,0)
	.Chart.FirstVisibleDate = #1/1/2001#
	.Columns.Add "Column"
	With .Items
		.AddBar .AddItem("Item 1"),"T2",#1/2/2001#,#1/4/2001#
		.AddBar .AddItem("Item 2"),"Task",#1/2/2001#,#1/4/2001#
	End With
End With
|
|
695
|
How can I change the color for all task bars

With G2antt1
	.Chart.Bars.Item("Task").Color = RGB(255,0,0)
	.Chart.FirstVisibleDate = #1/1/2001#
	.Columns.Add "Column"
	With .Items
		.AddBar .AddItem("Item 1"),"Task",#1/2/2001#,#1/4/2001#
	End With
End With
|
|
694
|
How can I change the shape for all task bars

With G2antt1
	.Chart.Bars.Item("Task").Shape = 4
	.Chart.FirstVisibleDate = #1/1/2001#
	.Columns.Add "Column"
	With .Items
		.AddBar .AddItem("Item 1"),"Task",#1/2/2001#,#1/4/2001#
	End With
End With
|
|
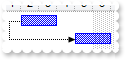
693
|
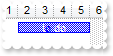
How can I change the shape of the task bar

With G2antt1
	.Chart.Bars.Copy("Task","T2").Shape = 19
	.Chart.FirstVisibleDate = #1/1/2001#
	.Columns.Add "Column"
	With .Items
		.AddBar .AddItem("Item 1"),"T2",#1/2/2001#,#1/4/2001#
	End With
End With
|
|
692
|
How can I change the pattern or style for all task bars

With G2antt1
	.Chart.Bars.Item("Task").Pattern = 5
	.Chart.FirstVisibleDate = #1/1/2001#
	.Columns.Add "Column"
	With .Items
		.AddBar .AddItem("Item 1"),"Task",#1/2/2001#,#1/4/2001#
	End With
End With
|
|
691
|
How can I change the pattern of the task bar

With G2antt1
	.Chart.Bars.Copy("Task","T2").Pattern = 5
	.Chart.FirstVisibleDate = #1/1/2001#
	.Columns.Add "Column"
	With .Items
		.AddBar .AddItem("Item 1"),"T2",#1/2/2001#,#1/4/2001#
	End With
End With
|
|
690
|
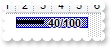
How can I add a percent bar in the chart area, so the task bar is splited for non working days or hours
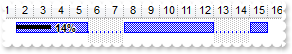
With G2antt1
	.Columns.Add "Task"
	.Chart.Bars.Add("Task%Progress:Split").Shortcut = "TS"
	.Chart.FirstVisibleDate = #1/1/2001#
	With .Items
		h = .AddItem("Task 1")
		.AddBar h,"TS",#1/2/2001#,#1/16/2001#,"P1"
		.ItemBar(h,"P1",12) = 0.14
		.ItemBar(h,"P1",14) = True
	End With
End With
|
|
689
|
How can I add a bar in the chart area, so the task bar is splited for non working days or hours
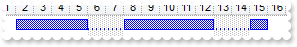
With G2antt1
	.Columns.Add "Task"
	.Chart.Bars.Add("Task:Split").Shortcut = "TS"
	.Chart.FirstVisibleDate = #1/1/2001#
	With .Items
		.AddBar .AddItem("Task 1"),"TS",#1/2/2001#,#1/16/2001#
	End With
End With
|
|
688
|
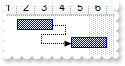
How can I add a split bar in the chart area
With G2antt1
	.Columns.Add "Task"
	.Chart.FirstVisibleDate = #1/1/2001#
	With .Items
		.AddBar .AddItem("Task 1"),"Split",#1/2/2001#,#1/6/2001#
	End With
End With
|
|
687
|
How can I add a progress bar in the chart area
With G2antt1
	.Columns.Add "Task"
	.Chart.FirstVisibleDate = #1/1/2001#
	With .Items
		.AddBar .AddItem("Task 1"),"Progress",#1/2/2001#,#1/6/2001#
	End With
End With
|
|
686
|
How can I add a milestone bar in the chart area

With G2antt1
	.Columns.Add "Task"
	.Chart.FirstVisibleDate = #1/1/2001#
	With .Items
		.AddBar .AddItem("Task 1"),"Milestone",#1/2/2001#,#1/2/2001#
	End With
End With
|
|
685
|
How can I add a summary bar in the chart area
With G2antt1
	.Columns.Add "Task"
	.Chart.FirstVisibleDate = #1/1/2001#
	With .Items
		.AddBar .AddItem("Task 1"),"Summary",#1/2/2001#,#1/6/2001#
	End With
End With
|
|
684
|
How can I add a project summary bar in the chart area
With G2antt1
	.Columns.Add "Task"
	.Chart.FirstVisibleDate = #1/1/2001#
	With .Items
		.AddBar .AddItem("Task 1"),"Project Summary",#1/2/2001#,#1/6/2001#
	End With
End With
|
|
683
|
How can I add a deadline bar in the chart area

With G2antt1
	.Columns.Add "Task"
	.Chart.FirstVisibleDate = #1/1/2001#
	With .Items
		.AddBar .AddItem("Task 1"),"Deadline",#1/2/2001#,#1/2/2001#
	End With
End With
|
|
682
|
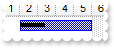
How can I add a task bar in the chart area

With G2antt1
	.Columns.Add "Task"
	.Chart.FirstVisibleDate = #1/1/2001#
	With .Items
		.AddBar .AddItem("Task 1"),"Task",#1/2/2001#,#1/4/2001#
	End With
End With
|
|
681
|
How can I assign a picture or an icon to a bar in the chart
With G2antt1
	.HTMLPicture("p1") = "c:\exontrol\images\zipdisk.gif"
	.Columns.Add "Task"
	.Chart.FirstVisibleDate = #1/1/2001#
	With .Items
		h = .AddItem("Task 1")
		.ItemHeight(h) = 48
		.AddBar h,"Task",#1/2/2001#,#1/6/2001#,"K1"
		.ItemBar(h,"K1",3) = "<img>p1</img>"
		.ItemBar(h,"K1",4) = 2
	End With
End With
|
|
680
|
How can I assign a picture or an icon to a bar in the chart
With G2antt1
	.Images "gBJJgBAIDAAGAAEAAQhYAf8Pf4hh0QihCJo2AEZjQAjEZFEaIEaEEaAIAkcbk0olUrlktl0vmExmUzmk1m03nE5nU7nk9n0/oFBoVDolFo1HpFJpVLplNp1PqFRqVTq" & _
	"lVq1XrFZrVbrldr1fsFhsVjslls1ntFptVrtltt1vuFxuVzul1u13vF5vV7vl9v1/wGBwWDwmFw2HxGJxWLxmNx0xiFdyOTh8Tf9ZymXx+QytcyNgz8r0OblWjyWds+m" & _
	"0ka1Vf1ta1+r1mos2xrG2xeZ0+a0W0qOx3GO4NV3WeyvD2XJ5XL5nN51aiw+lfSj0gkUkAEllHanHI5j/cHg8EZf7w8vl8j4f/qfEZeB09/vjLAB30+kZQAP/P5/H6/y" & _
	"NAOAEAwCjMBwFAEDwJBMDwLBYAP2/8Hv8/gAGAD8LQs9w/nhDY/oygIA="
	.Columns.Add "Task"
	.Chart.FirstVisibleDate = #1/1/2001#
	With .Items
		h = .AddItem("Task 1")
		.AddBar h,"Task",#1/2/2001#,#1/6/2001#,"K1"
		.ItemBar(h,"K1",3) = "<img>1</img>"
	End With
End With
|
|
679
|
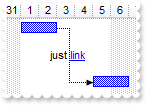
How can I display or add an anchor or a hyperlink in the link
With G2antt1
	.Columns.Add "Task"
	.Chart.FirstVisibleDate = #1/1/2001#
	With .Items
		h1 = .AddItem("Task 1")
		.AddBar h1,"Task",#1/1/2001#,#1/3/2001#,"K1"
		.AddItem ""
		.AddItem ""
		h2 = .AddItem("Task 2")
		.AddBar h2,"Task",#1/5/2001#,#1/7/2001#,"K2"
		.AddLink "L1",h1,"K1",h2,"K2"
		.Link("L1",12) = "just <a1>link</a>"
	End With
End With
|
|
678
|
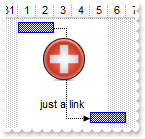
How can I display a picture or an icon on the link
With G2antt1
	.Images "gBJJgBAIDAAGAAEAAQhYAf8Pf4hh0QihCJo2AEZjQAjEZFEaIEaEEaAIAkcbk0olUrlktl0vmExmUzmk1m03nE5nU7nk9n0/oFBoVDolFo1HpFJpVLplNp1PqFRqVTq" & _
	"lVq1XrFZrVbrldr1fsFhsVjslls1ntFptVrtltt1vuFxuVzul1u13vF5vV7vl9v1/wGBwWDwmFw2HxGJxWLxmNx0xiFdyOTh8Tf9ZymXx+QytcyNgz8r0OblWjyWds+m" & _
	"0ka1Vf1ta1+r1mos2xrG2xeZ0+a0W0qOx3GO4NV3WeyvD2XJ5XL5nN51aiw+lfSj0gkUkAEllHanHI5j/cHg8EZf7w8vl8j4f/qfEZeB09/vjLAB30+kZQAP/P5/H6/y" & _
	"NAOAEAwCjMBwFAEDwJBMDwLBYAP2/8Hv8/gAGAD8LQs9w/nhDY/oygIA="
	.Columns.Add "Task"
	.Chart.FirstVisibleDate = #1/1/2001#
	With .Items
		h1 = .AddItem("Task 1")
		.AddBar h1,"Task",#1/1/2001#,#1/3/2001#,"K1"
		.AddItem ""
		.AddItem ""
		.AddItem ""
		.AddItem ""
		h2 = .AddItem("Task 2")
		.AddBar h2,"Task",#1/5/2001#,#1/7/2001#,"K2"
		.AddLink "L1",h1,"K1",h2,"K2"
		.Link("L1",12) = "just <img>1</img> link"
	End With
End With
|
|
677
|
How can I display a picture or an icon on the link
With G2antt1
	.HTMLPicture("pic1") = "c:\exontrol\images\zipdisk.gif"
	.Columns.Add "Task"
	.Chart.FirstVisibleDate = #1/1/2001#
	With .Items
		h1 = .AddItem("Task 1")
		.AddBar h1,"Task",#1/1/2001#,#1/3/2001#,"K1"
		.AddItem ""
		.AddItem ""
		.AddItem ""
		.AddItem ""
		h2 = .AddItem("Task 2")
		.AddBar h2,"Task",#1/5/2001#,#1/7/2001#,"K2"
		.AddLink "L1",h1,"K1",h2,"K2"
		.Link("L1",12) = "<img>pic1</img><br><br>just a link"
	End With
End With
|
|
676
|
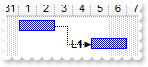
How can I display some HTML text or caption on link
With G2antt1
	.Columns.Add "Task"
	.Chart.FirstVisibleDate = #1/1/2001#
	With .Items
		h1 = .AddItem("Task 1")
		.AddBar h1,"Task",#1/1/2001#,#1/3/2001#,"K1"
		h2 = .AddItem("Task 2")
		.AddBar h2,"Task",#1/5/2001#,#1/7/2001#,"K2"
		.AddLink "L1",h1,"K1",h2,"K2"
		.Link("L1",12) = "L<b>1</b>"
	End With
End With
|
|
675
|
How can I assign a tooltip to a link
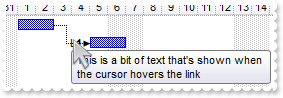
With G2antt1
	.Columns.Add "Task"
	.Chart.FirstVisibleDate = #1/1/2001#
	With .Items
		h1 = .AddItem("Task 1")
		.AddBar h1,"Task",#1/1/2001#,#1/3/2001#,"K1"
		h2 = .AddItem("Task 2")
		.AddBar h2,"Task",#1/5/2001#,#1/7/2001#,"K2"
		.AddLink "L1",h1,"K1",h2,"K2"
		.Link("L1",12) = "L<b>1</b>"
		.Link("L1",13) = "This is a bit of text that's shown when the cursor hovers the link"
	End With
End With
|
|
674
|
Can I change the width or the size of the link
With G2antt1
	.Columns.Add "Task"
	.Chart.FirstVisibleDate = #1/1/2001#
	With .Items
		h1 = .AddItem("Task 1")
		.AddBar h1,"Task",#1/2/2001#,#1/4/2001#,"K1"
		h2 = .AddItem("Task 2")
		.AddBar h2,"Task",#1/5/2001#,#1/7/2001#,"K2"
		.AddLink "L1",h1,"K1",h2,"K2"
		.Link("L1",9) = 0
		.Link("L1",10) = 2
	End With
End With
|
|
673
|
Can I change the style of the link
With G2antt1
	.Columns.Add "Task"
	.Chart.FirstVisibleDate = #1/1/2001#
	With .Items
		h1 = .AddItem("Task 1")
		.AddBar h1,"Task",#1/2/2001#,#1/4/2001#,"K1"
		h2 = .AddItem("Task 2")
		.AddBar h2,"Task",#1/5/2001#,#1/7/2001#,"K2"
		.AddLink "L1",h1,"K1",h2,"K2"
		.Link("L1",9) = 4
	End With
End With
|
|
672
|
Can I change the color of the link
With G2antt1
	.Columns.Add "Task"
	.Chart.FirstVisibleDate = #1/1/2001#
	With .Items
		h1 = .AddItem("Task 1")
		.AddBar h1,"Task",#1/2/2001#,#1/4/2001#,"K1"
		h2 = .AddItem("Task 2")
		.AddBar h2,"Task",#1/5/2001#,#1/7/2001#,"K2"
		.AddLink "L1",h1,"K1",h2,"K2"
		.Link("L1",8) = 255
	End With
End With
|
|
671
|
Can I change the part of the bar where the link ends
With G2antt1
	.Columns.Add "Task"
	.Chart.FirstVisibleDate = #1/1/2001#
	With .Items
		h1 = .AddItem("Task 1")
		.AddBar h1,"Task",#1/2/2001#,#1/4/2001#,"K1"
		h2 = .AddItem("Task 2")
		.AddBar h2,"Task",#1/5/2001#,#1/7/2001#,"K2"
		.AddLink "L1",h1,"K1",h2,"K2"
		.Link("L1",6) = 1
		.Link("L1",7) = 1
	End With
End With
|
|
670
|
Can I change the part of the bar where the link starts
With G2antt1
	.Columns.Add "Task"
	.Chart.FirstVisibleDate = #1/1/2001#
	With .Items
		h1 = .AddItem("Task 1")
		.AddBar h1,"Task",#1/2/2001#,#1/4/2001#,"K1"
		h2 = .AddItem("Task 2")
		.AddBar h2,"Task",#1/5/2001#,#1/7/2001#,"K2"
		.AddLink "L1",h1,"K1",h2,"K2"
		.Link("L1",6) = 0
	End With
End With
|
|
669
|
How can I associate an extra data to a link
With G2antt1
	.Columns.Add "Task"
	.Chart.FirstVisibleDate = #1/1/2001#
	With .Items
		h1 = .AddItem("Task 1")
		.AddBar h1,"Task",#1/2/2001#,#1/4/2001#,"K1"
		h2 = .AddItem("Task 2")
		.AddBar h2,"Task",#1/5/2001#,#1/7/2001#,"K2"
		.AddLink "L1",h1,"K1",h2,"K2"
		.Link("L1",5) = "your data"
	End With
End With
|
|
668
|
How can I show or hide a specified link
With G2antt1
	.Columns.Add "Task"
	.Chart.FirstVisibleDate = #1/1/2001#
	With .Items
		h1 = .AddItem("Task 1")
		.AddBar h1,"Task",#1/2/2001#,#1/4/2001#,"K1"
		h2 = .AddItem("Task 2")
		.AddBar h2,"Task",#1/5/2001#,#1/7/2001#,"K2"
		.AddLink "L1",h1,"K1",h2,"K2"
		.Link("L1",3) = False
	End With
End With
|
|
667
|
How can I get the key of the bar where the link end
With G2antt1
	.Columns.Add "Task"
	.Chart.FirstVisibleDate = #1/1/2001#
	With .Items
		h1 = .AddItem("Task 1")
		.AddBar h1,"Task",#1/2/2001#,#1/4/2001#,"K1"
		h2 = .AddItem("Task 2")
		.AddBar h2,"Task",#1/5/2001#,#1/7/2001#,"K2"
		.AddLink "L1",h1,"K1",h2,"K2"
		.AddItem .Link("L1",3)
	End With
End With
|
|
666
|
How can I get the key of the bar where the link starts
With G2antt1
	.Columns.Add "Task"
	.Chart.FirstVisibleDate = #1/1/2001#
	With .Items
		h1 = .AddItem("Task 1")
		.AddBar h1,"Task",#1/2/2001#,#1/4/2001#,"K1"
		h2 = .AddItem("Task 2")
		.AddBar h2,"Task",#1/5/2001#,#1/7/2001#,"K2"
		.AddLink "L1",h1,"K1",h2,"K2"
		.AddItem .Link("L1",1)
	End With
End With
|
|
665
|
How can I get the handle of the item where the link ends
With G2antt1
	.Columns.Add "Task"
	.Chart.FirstVisibleDate = #1/1/2001#
	With .Items
		h1 = .AddItem("Task 1")
		.AddBar h1,"Task",#1/2/2001#,#1/4/2001#,"K1"
		h2 = .AddItem("Task 2")
		.AddBar h2,"Task",#1/5/2001#,#1/7/2001#,"K2"
		.AddLink "L1",h1,"K1",h2,"K2"
		.AddItem .Link("L1",2)
	End With
End With
|
|
664
|
How can I get the handle of the item where the link starts
With G2antt1
	.Columns.Add "Task"
	.Chart.FirstVisibleDate = #1/1/2001#
	With .Items
		h1 = .AddItem("Task 1")
		.AddBar h1,"Task",#1/2/2001#,#1/4/2001#,"K1"
		h2 = .AddItem("Task 2")
		.AddBar h2,"Task",#1/5/2001#,#1/7/2001#,"K2"
		.AddLink "L1",h1,"K1",h2,"K2"
		.AddItem .Link("L1",0)
	End With
End With
|
|
663
|
How can I enumerate the links in the chart
With G2antt1
	.Columns.Add "Task"
	.Chart.FirstVisibleDate = #1/1/2001#
	With .Items
		h1 = .AddItem("Task 1")
		.AddBar h1,"Task",#1/2/2001#,#1/4/2001#,"K1"
		h2 = .AddItem("Task 2")
		.AddBar h2,"Task",#1/5/2001#,#1/7/2001#,"K2"
		.AddLink "L1",h1,"K1",h2,"K2"
		.AddLink "L2",h2,"K2",h1,"K1"
		.AddItem .FirstLink
		.AddItem .NextLink(.FirstLink)
	End With
End With
|
|
662
|
How can I access the properties and method of the link between two bars
With G2antt1
	.Columns.Add "Task"
	.Chart.FirstVisibleDate = #1/1/2001#
	With .Items
		h1 = .AddItem("Task 1")
		.AddBar h1,"Task",#1/1/2001#,#1/3/2001#,"K1"
		h2 = .AddItem("Task 2")
		.AddBar h2,"Task",#1/5/2001#,#1/7/2001#,"K2"
		.AddLink "L1",h1,"K1",h2,"K2"
		.Link("L1",12) = "L<b>1</b>"
	End With
End With
|
|
661
|
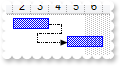
How can I remove a link between two bars
With G2antt1
	.Columns.Add "Task"
	.Chart.FirstVisibleDate = #1/1/2001#
	With .Items
		h1 = .AddItem("Task 1")
		.AddBar h1,"Task",#1/2/2001#,#1/4/2001#,"K1"
		h2 = .AddItem("Task 2")
		.AddBar h2,"Task",#1/5/2001#,#1/7/2001#,"K2"
		.AddLink "L1",h1,"K1",h2,"K2"
		.ClearLinks
	End With
End With
|
|
660
|
How can I remove a link between two bars
With G2antt1
	.Columns.Add "Task"
	.Chart.FirstVisibleDate = #1/1/2001#
	With .Items
		h1 = .AddItem("Task 1")
		.AddBar h1,"Task",#1/2/2001#,#1/4/2001#,"K1"
		h2 = .AddItem("Task 2")
		.AddBar h2,"Task",#1/5/2001#,#1/7/2001#,"K2"
		.AddLink "L1",h1,"K1",h2,"K2"
		.RemoveLink "L1"
	End With
End With
|
|
659
|
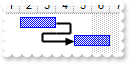
How do I add a link between two bars
With G2antt1
	.Columns.Add "Task"
	.Chart.FirstVisibleDate = #1/1/2001#
	With .Items
		h1 = .AddItem("Task 1")
		.AddBar h1,"Task",#1/2/2001#,#1/4/2001#,"K1"
		h2 = .AddItem("Task 2")
		.AddBar h2,"Task",#1/5/2001#,#1/7/2001#,"K2"
		.AddLink "L1",h1,"K1",h2,"K2"
	End With
End With
|
|
658
|
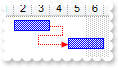
How do I ungroup the bars in the chart
With G2antt1
	.Columns.Add "Task"
	.Chart.FirstVisibleDate = #1/1/2001#
	With .Items
		h1 = .AddItem("Task 1")
		.AddBar h1,"Task",#1/2/2001#,#1/4/2001#,"K1"
		h2 = .AddItem("Task 2")
		.AddBar h2,"Task",#1/5/2001#,#1/7/2001#,"K2"
		.GroupBars h1,"K1",True,h2,"K2",True
		.GroupBars h1,"K1",False,h2,"K2",False
		.UngroupBars h1,"K1",h2,"K2"
	End With
End With
|
|
657
|
How do I group one or more bars in the chart, so they are moved together
With G2antt1
	.Columns.Add "Task"
	.Chart.FirstVisibleDate = #1/1/2001#
	With .Items
		h1 = .AddItem("Task 1")
		.AddBar h1,"Task",#1/2/2001#,#1/4/2001#,"K1"
		h2 = .AddItem("Task 2")
		.AddBar h2,"Task",#1/5/2001#,#1/7/2001#,"K2"
		.GroupBars h1,"K1",True,h2,"K2",True
		.GroupBars h1,"K1",False,h2,"K2",False
	End With
End With
|
|
656
|
How do I find the number or count of bars in the item
With G2antt1
	.Columns.Add "Task"
	.Chart.FirstVisibleDate = #1/1/2001#
	With .Items
		h = .AddItem("Task 1")
		.AddBar h,"Task",#1/1/2001#,#1/2/2001#,"K1"
		.AddBar h,"Task",#1/4/2001#,#1/6/2001#,"K2"
		.ItemBar(h,"K2",3) = .ItemBar(h,"<*>",256)
	End With
End With
|
|
655
|
How can I assign any extra data to a bar in the chart
With G2antt1
	.Columns.Add "Task"
	.Chart.FirstVisibleDate = #1/1/2001#
	With .Items
		h = .AddItem("Task 1")
		.AddBar h,"Task",#1/2/2001#,#1/6/2001#,"K1"
		.ItemBar(h,"K1",17) = "your data"
	End With
End With
|
|
654
|
How can I enable or disable resizing the percent value of a progress bar, at runtime
With G2antt1
	.Columns.Add "Task"
	.Chart.FirstVisibleDate = #1/1/2001#
	.Chart.Bars.Add("Task%Progress").Shortcut = "Percent"
	With .Items
		h = .AddItem("Task 1")
		.AddBar h,"Percent",#1/2/2001#,#1/6/2001#,"K1"
		.ItemBar(h,"K1",12) = 0.35
		.ItemBar(h,"K1",16) = False
	End With
End With
|
|
653
|
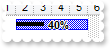
Is there any way to change the background color for percent value being displayed on the progress bar
With G2antt1
	.Columns.Add "Task"
	.Chart.FirstVisibleDate = #1/1/2001#
	.Chart.Bars.Add("Task%Progress").Shortcut = "Percent"
	With .Items
		h = .AddItem("Task 1")
		.AddBar h,"Percent",#1/2/2001#,#1/6/2001#,"K1"
		.ItemBar(h,"K1",12) = 0.35
		.ItemBar(h,"K1",14) = True
		.ItemBar(h,"K1",13) = "<bgcolor=FF0000> %p%</bgcolor>"
	End With
End With
|
|
652
|
Is there any way to change the color for percent value being displayed on the progress bar
With G2antt1
	.Columns.Add "Task"
	.Chart.FirstVisibleDate = #1/1/2001#
	.Chart.Bars.Add("Task%Progress").Shortcut = "Percent"
	With .Items
		h = .AddItem("Task 1")
		.AddBar h,"Percent",#1/2/2001#,#1/6/2001#,"K1"
		.ItemBar(h,"K1",12) = 0.35
		.ItemBar(h,"K1",14) = True
		.ItemBar(h,"K1",13) = "<fgcolor=FF0000>%p%</fgcolor>"
	End With
End With
|
|
651
|
Is there any way to change the font for percent value being displayed on the progress bar
With G2antt1
	.Columns.Add "Task"
	.Chart.FirstVisibleDate = #1/1/2001#
	.Chart.Bars.Add("Task%Progress").Shortcut = "Percent"
	With .Items
		h = .AddItem("Task 1")
		.AddBar h,"Percent",#1/2/2001#,#1/6/2001#,"K1"
		.ItemBar(h,"K1",12) = 0.35
		.ItemBar(h,"K1",14) = True
		.ItemBar(h,"K1",13) = "<b><font Tahoma;12>%%p</font></b>"
	End With
End With
|
|
650
|
How can I horizontally align the caption / percent of a progress-bar
With G2antt1
	.BeginUpdate
	.Columns.Add "Task"
	With .Chart
		.LevelCount = 2
		.PaneWidth(False) = 128
		.FirstVisibleDate = #1/1/2001#
		With .Bars.Add("Task%Progress")
			.Shortcut = "Percent"
			.Def(14) = True
			.Def(12) = 1
		End With
	End With
	With .Items
		h = .AddItem("Left")
		.AddBar h,"Percent",#1/2/2001#,#1/6/2001#,"K1"
		.ItemBar(h,"K1",15) = 0
		h = .AddItem("Center")
		.AddBar h,"Percent",#1/2/2001#,#1/6/2001#,"K1"
		.ItemBar(h,"K1",15) = 1
		h = .AddItem("Right")
		.AddBar h,"Percent",#1/2/2001#,#1/6/2001#,"K1"
		.ItemBar(h,"K1",15) = 2
		h = .AddItem("Left")
		.AddBar h,"Percent",#1/2/2001#,#1/6/2001#,"K1"
		.ItemBar(h,"K1",15) = 0
		.ItemBar(h,"K1",12) = 0.5
		h = .AddItem("Center")
		.AddBar h,"Percent",#1/2/2001#,#1/6/2001#,"K1"
		.ItemBar(h,"K1",12) = 0.5
		.ItemBar(h,"K1",15) = 1
		h = .AddItem("Right")
		.AddBar h,"Percent",#1/2/2001#,#1/6/2001#,"K1"
		.ItemBar(h,"K1",15) = 2
		.ItemBar(h,"K1",12) = 0.5
	End With
	.EndUpdate
End With
|
|
649
|
Is there any way to change the format of the percent being displayed on the progress bar
With G2antt1
	.Columns.Add "Task"
	.Chart.FirstVisibleDate = #1/1/2001#
	.Chart.Bars.Add("Task%Progress").Shortcut = "Percent"
	With .Items
		h = .AddItem("Task 1")
		.AddBar h,"Percent",#1/2/2001#,#1/6/2001#,"K1"
		.ItemBar(h,"K1",12) = 0.4
		.ItemBar(h,"K1",14) = True
		.ItemBar(h,"K1",13) = "<b>%p/100</b>"
	End With
End With
|
|
648
|
How can I show or hide the percent value in the progress bar
With G2antt1
	.Columns.Add "Task"
	.Chart.FirstVisibleDate = #1/1/2001#
	.Chart.Bars.Add("Task%Progress").Shortcut = "Percent"
	With .Items
		h = .AddItem("Task 1")
		.AddBar h,"Percent",#1/2/2001#,#1/6/2001#,"K1"
		.ItemBar(h,"K1",12) = 0.4
		.ItemBar(h,"K1",14) = True
	End With
End With
|
|
647
|
How can I change the percent value in a progress bar
With G2antt1
	.Columns.Add "Task"
	.Chart.FirstVisibleDate = #1/1/2001#
	.Chart.Bars.Add("Task%Progress").Shortcut = "Percent"
	With .Items
		h = .AddItem("Task 1")
		.AddBar h,"Percent",#1/2/2001#,#1/6/2001#,"K1"
		.ItemBar(h,"K1",12) = 0.4
	End With
End With
|
|
646
|
How can I add a percent bar
' BarResize event - Occurs when a bar is moved or resized.
Private Sub G2antt1_BarResize(ByVal Item As Long, ByVal Key As Variant)
	With G2antt1
		Debug.Print( Key )
	End With
End Sub

With G2antt1
	.BeginUpdate
	.Columns.Add "Task"
	With .Chart
		.LevelCount = 2
		.FirstVisibleDate = #1/1/2001#
		.PaneWidth(False) = 64
		With .Bars.Add("Task%Progress")
			.Shortcut = "P"
			.Def(14) = True
		End With
	End With
	With .Items
		h = .AddItem("Task 1")
		.AddBar h,"P",#1/2/2001#,#1/6/2001#,"K1"
		.ItemBar(h,"K1",12) = 0.4
		h = .AddItem("Task 2")
		.AddBar h,"Task%Progress",#1/2/2001#,#1/6/2001#,"K2"
		.ItemBar(h,"K2",12) = 0.15
	End With
	.EndUpdate
End With
|
|
645
|
How can I fix or lock a specified bar at runtime, in the chart
With G2antt1
	.Columns.Add "Task"
	.Chart.FirstVisibleDate = #1/1/2001#
	With .Items
		h = .AddItem("Task 1")
		.AddBar h,"Task",#1/2/2001#,#1/6/2001#,"K1"
		.ItemBar(h,"K1",10) = False
		.ItemBar(h,"K1",11) = False
	End With
End With
|
|
644
|
How can I enabled or disable moving a specified bar at runtime, in the chart
With G2antt1
	.Columns.Add "Task"
	.Chart.FirstVisibleDate = #1/1/2001#
	With .Items
		h = .AddItem("Task 1")
		.AddBar h,"Task",#1/2/2001#,#1/6/2001#,"K1"
		.ItemBar(h,"K1",10) = False
		.ItemBar(h,"K1",11) = False
	End With
End With
|
|
643
|
How can I enabled or disable sizing a specified bar at runtime, in the chart
With G2antt1
	.Columns.Add "Task"
	.Chart.FirstVisibleDate = #1/1/2001#
	With .Items
		h = .AddItem("Task 1")
		.AddBar h,"Task",#1/2/2001#,#1/6/2001#,"K1"
		.ItemBar(h,"K1",10) = False
	End With
End With
|
|
642
|
How can I change the key of the bar in the chart
With G2antt1
	.Columns.Add "Task"
	.Chart.FirstVisibleDate = #1/1/2001#
	With .Items
		h = .AddItem("Task 1")
		.AddBar h,"Task",#1/2/2001#,#1/6/2001#,"K1"
		.ItemBar(h,"K1",9) = "NewK"
		.ItemBar(h,"NewK",3) = .ItemBar(h,"NewK",9)
	End With
End With
|
|
641
|
Can I add a bar in the chart, using your EBN files
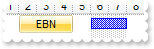
With G2antt1
	.VisualAppearance.Add 1,"c:\exontrol\images\normal.ebn"
	.Columns.Add "Task"
	.Chart.FirstVisibleDate = #1/1/2001#
	With .Items
		h = .AddItem("Task 1")
		.AddBar h,"",#1/2/2001#,#1/5/2001#,"K1"," EBN "
		.ItemBar(h,"K1",7) = 16777216
		.AddBar h,"Task",#1/6/2001#,#1/8/2001#,"K2"
	End With
End With
|
|
640
|
How can I change the background color of the bar in the chart
With G2antt1
	.Columns.Add "Task"
	.Chart.FirstVisibleDate = #1/1/2001#
	.Chart.Bars.Copy("Task","TaskR").Color = RGB(255,0,0)
	With .Items
		h = .AddItem("Task 1")
		.AddBar h,"TaskR",#1/2/2001#,#1/6/2001#,"K1"
	End With
End With
|
|
639
|
How can I change the background color of the bar in the chart
With G2antt1
	.Columns.Add "Task"
	.Chart.FirstVisibleDate = #1/1/2001#
	.Chart.ShowNonworkingDates = 0
	With .Items
		h = .AddItem("Task 1")
		.AddBar h,"Task",#1/2/2001#,#1/6/2001#,"K1"
		.ItemBar(h,"K1",7) = 8421504
	End With
End With
|
|
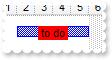
638
|
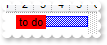
How can I change the background color of the HTML text or caption of the bar in the chart
With G2antt1
	.Columns.Add "Task"
	.Chart.FirstVisibleDate = #1/1/2001#
	With .Items
		h = .AddItem("Task 1")
		.AddBar h,"Task",#1/2/2001#,#1/6/2001#,"K1"
		.ItemBar(h,"K1",3) = "<bgcolor=FF0000> to do </bgcolor>"
	End With
End With
|
|
637
|
How can I change the foreground color of the HTML text or caption of the bar in the chart
With G2antt1
	.Columns.Add "Task"
	.Chart.FirstVisibleDate = #1/1/2001#
	With .Items
		h = .AddItem("Task 1")
		.AddBar h,"Task",#1/2/2001#,#1/6/2001#,"K1","t<fgcolor=0000FF>o</fgcolor> do"
		.ItemBar(h,"K1",8) = 16777215
	End With
End With
|
|
636
|
How can I change the foreground color of the HTML text or caption of the bar in the chart
With G2antt1
	.Columns.Add "Task"
	.Chart.FirstVisibleDate = #1/1/2001#
	With .Items
		h = .AddItem("Task 1")
		.AddBar h,"Task",#1/2/2001#,#1/6/2001#,"K1"
		.ItemBar(h,"K1",3) = "<bgcolor=FF0000> to do </bgcolor>"
		.ItemBar(h,"K1",8) = 16777215
	End With
End With
|
|
635
|
How can I assign a tooltip to a bar in the chart
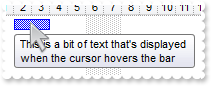
With G2antt1
	.Columns.Add "Task"
	.Chart.FirstVisibleDate = #1/1/2001#
	With .Items
		h = .AddItem("Task 1")
		.AddBar h,"Task",#1/2/2001#,#1/4/2001#,"K1"
		.ItemBar(h,"K1",6) = "This is a bit of text that's displayed when the cursor hovers the bar"
	End With
End With
|
|
634
|
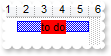
How can I vertically align the HTML text or caption of the bar in the chart
With G2antt1
	.Columns.Add "Task"
	.Chart.FirstVisibleDate = #1/1/2001#
	With .Items
		h = .AddItem("Task 1")
		.ItemHeight(h) = 32
		.AddBar h,"Task",#1/2/2001#,#1/6/2001#,"K1"
		.ItemBar(h,"K1",3) = "<bgcolor=FF0000> to do </bgcolor>"
		.ItemBar(h,"K1",5) = 0
	End With
End With
|
|
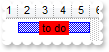
633
|
How can I align the HTML text or caption of the bar in the chart
With G2antt1
	.Columns.Add "Task"
	.Chart.FirstVisibleDate = #1/1/2001#
	With .Items
		h = .AddItem("Task 1")
		.AddBar h,"Task",#1/2/2001#,#1/6/2001#,"K1"
		.ItemBar(h,"K1",3) = "<bgcolor=FF0000> to do </bgcolor>"
		.ItemBar(h,"K1",4) = 0
	End With
End With
|
|
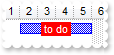
632
|
How can I assign a text or some HTML caption to a bar in the chart
With G2antt1
	.Columns.Add "Task"
	.Chart.FirstVisibleDate = #1/1/2001#
	With .Items
		h = .AddItem("Task 1")
		.AddBar h,"Task",#1/2/2001#,#1/6/2001#,"K1"
		.ItemBar(h,"K1",3) = " <bgcolor=FF0000>to do</bgcolor> "
	End With
End With
|
|
631
|
How can I change the ending date of the bar in the chart
With G2antt1
	.Columns.Add "Task"
	.Chart.FirstVisibleDate = #1/1/2001#
	With .Items
		h = .AddItem("Task 1")
		.AddBar h,"Task",#1/2/2001#,#1/4/2001#,"K1"
		.ItemBar(h,"K1",2) = #1/6/2001#
	End With
End With
|
|
630
|
How can I change the starting date of the bar in the chart
With G2antt1
	.Columns.Add "Task"
	.Chart.FirstVisibleDate = #1/1/2001#
	With .Items
		h = .AddItem("Task 1")
		.AddBar h,"Task",#1/2/2001#,#1/4/2001#,"K1"
		.ItemBar(h,"K1",1) = #1/1/2001#
	End With
End With
|
|
629
|
How can I change the style or the name of the bar in the chart

With G2antt1
	.Columns.Add "Task"
	.Chart.FirstVisibleDate = #1/1/2001#
	With .Items
		h = .AddItem("Task 1")
		.AddBar h,"Task",#1/2/2001#,#1/4/2001#,"K1"
		.ItemBar(h,"K1",0) = "Progress"
	End With
End With
|
|
628
|
How can I access properties and methods of the bar in the chart
With G2antt1
	.Columns.Add "Task"
	.Chart.FirstVisibleDate = #1/1/2001#
	With .Items
		h = .AddItem("Task 1")
		.AddBar h,"Task",#1/2/2001#,#1/4/2001#,"K1"
		.ItemBar(h,"K1",0) = "Progress"
	End With
End With
|
|
627
|
How can I remove all bars in the item
With G2antt1
	.Columns.Add "Task"
	.Chart.FirstVisibleDate = #1/1/2001#
	With .Items
		h = .AddItem("Task 1")
		.AddBar h,"Task",#1/2/2001#,#1/4/2001#,"K1"
		.ClearBars h
	End With
End With
|
|
626
|
How can I remove a bar from the chart
With G2antt1
	.Columns.Add "Task"
	.Chart.FirstVisibleDate = #1/1/2001#
	With .Items
		h = .AddItem("Task 1")
		.AddBar h,"Task",#1/2/2001#,#1/4/2001#,"K1"
		.RemoveBar h,"K1"
	End With
End With
|
|
625
|
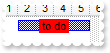
How can I add a bar and some text inside, in the chart area
With G2antt1
	.Columns.Add "Task"
	.Chart.FirstVisibleDate = #1/1/2001#
	With .Items
		.AddBar .AddItem("Task 1"),"Task",#1/2/2001#,#1/6/2001#,," to do "
	End With
End With
|
|
624
|
How can I add a bar and some text inside, in the chart area
With G2antt1
	.Columns.Add "Task"
	.Chart.FirstVisibleDate = #1/1/2001#
	With .Items
		.AddBar .AddItem("Task 1"),"Task",#1/2/2001#,#1/6/2001#,,"<bgcolor=FF0000> to do </bgcolor>"
	End With
End With
|
|
623
|
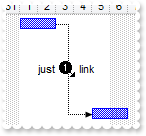
How can I add an anchor or a hyperline in the chart area
With G2antt1
	.Columns.Add "Task"
	.Chart.FirstVisibleDate = #1/1/2001#
	With .Items
		.AddBar .AddItem("Task 1"),"",#1/2/2001#,#1/14/2001#,,"just a <a1>link</a>"
	End With
End With
|
|
622
|
How can I add some text or captions in the chart area
With G2antt1
	.Columns.Add "Task"
	.Chart.FirstVisibleDate = #1/1/2001#
	With .Items
		.AddBar .AddItem("Task 1"),"",#1/2/2001#,#1/14/2001#,,"just a <b>caption</b>"
	End With
End With
|
|
621
|
How can I add a bar in the chart area

With G2antt1
	.Columns.Add "Task"
	.Chart.FirstVisibleDate = #1/1/2001#
	With .Items
		.AddBar .AddItem("Task 1"),"Task",#1/2/2001#,#1/4/2001#
	End With
End With
|
|
620
|
Is there any option to put a picture or an icon to the thumb part of the scroll bar
With G2antt1
	.Images "gBJJgBAIDAAGAAEAAQhYAf8Pf4hh0QihCJo2AEZjQAjEZFEaIEaEEaAIAkcbk0olUrlktl0vmExmUzmk1m03nE5nU7nk9n0/oFBoVDolFo1HpFJpVLplNp1PqFRqVTq" & _
	"lVq1XrFZrVbrldr1fsFhsVjslls1ntFptVrtltt1vuFxuVzul1u13vF5vV7vl9v1/wGBwWDwmFw2HxGJxWLxmNx0xiFdyOTh8Tf9ZymXx+QytcyNgz8r0OblWjyWds+m" & _
	"0ka1Vf1ta1+r1mos2xrG2xeZ0+a0W0qOx3GO4NV3WeyvD2XJ5XL5nN51aiw+lfSj0gkUkAEllHanHI5j/cHg8EZf7w8vl8j4f/qfEZeB09/vjLAB30+kZQAP/P5/H6/y" & _
	"NAOAEAwCjMBwFAEDwJBMDwLBYAP2/8Hv8/gAGAD8LQs9w/nhDY/oygIA="
	.ScrollPartCaption(2,256) = "<img>1</img>"
	.ScrollThumbSize(2) = 24
End With
|
|
619
|
How can I scroll fast the chart, or page by page
With G2antt1
	.Images "gBJJgBAIDAAGAAEAAQhYAf8Pf4hh0QihCJo2AEZjQAjEZFEaIEaEEaAIAkcbk0olUrlktl0vmExmUzmk1m03nE5nU7nk9n0/oFBoVDolFo1HpFJpVLplNp1PqFRqVTq" & _
	"lVq1XrFZrVbrldr1fsFhsVjslls1ntFptVrtltt1vuFxuVzul1u13vF5vV7vl9v1/wGBwWDwmFw2HxGJxWLxmNx0xiFdyOTh8Tf9ZymXx+QytcyNgz8r0OblWjyWds+m" & _
	"0ka1Vf1ta1+r1mos2xrG2xeZ0+a0W0qOx3GO4NV3WeyvD2XJ5XL5nN51aiw+lfSj0gkUkAEllHanHI5j/cHg8EZf7w8vl8j4f/qfEZeB09/vjLAB30+kZQAP/P5/H6/y" & _
	"NAOAEAwCjMBwFAEDwJBMDwLBYAP2/8Hv8/gAGAD8LQs9w/nhDY/oygIA="
	.ScrollHeight = 20
	.ScrollButtonWidth = 20
	.AllowChartScrollPage = True
	.ScrollPartCaption(2,2048) = "<img>1</img>"
	.ScrollPartCaption(2,32) = "<img>2</img>"
End With
|
|
618
|
How can I scroll fast the chart, or page by page
With G2antt1
	.ScrollButtonWidth = 16
	.AllowChartScrollPage = True
	.ScrollPartCaption(2,2048) = "<<"
	.ScrollPartCaption(2,32) = ">>"
End With
|
|
617
|
How can I scroll fast the chart, or page by page
With G2antt1
	.AllowChartScrollPage = True
End With
|
|
616
|
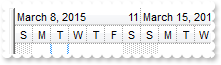
How can I display years, from 3 to 3
With G2antt1
	.Chart.UnitWidth = 64
	With .Chart.Level(0)
		.Label = "<%yyyy%>"
		.Unit = 0
		.Count = 3
	End With
End With
|
|
615
|
How can I display years
With G2antt1
	.Chart.UnitWidth = 64
	With .Chart.Level(0)
		.Label = "<%yy%>"
		.Unit = 0
	End With
End With
|
|
614
|
How can I display years
With G2antt1
	.Chart.UnitWidth = 48
	.Chart.Level(0).Label = 0
End With
|
|
613
|
How can I display months, from 3 to 3
With G2antt1
	.Chart.FirstVisibleDate = #1/1/2001#
	.Chart.LevelCount = 2
	.Chart.UnitWidth = 64
	.Chart.Level(0).Label = 1
	With .Chart.Level(1)
		.Label = "<%mmmm%>"
		.Unit = 16
		.Count = 3
	End With
End With
|
|
612
|
How can I display months
With G2antt1
	.Chart.UnitWidth = 64
	.Chart.LevelCount = 2
	.Chart.Level(0).Label = 1
	With .Chart.Level(1)
		.Label = "<%mmmm%>/<%yy%>"
		.Unit = 16
	End With
End With
|
|
611
|
How can I display months
With G2antt1
	.Chart.LevelCount = 2
	.Chart.UnitWidth = 64
	.Chart.Level(0).Label = 1
	.Chart.Level(1).Label = 16
End With
|
|
610
|
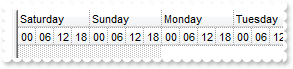
How can I display weeks
With G2antt1
	.Chart.LevelCount = 2
	.Chart.UnitWidth = 64
	.Chart.Level(0).Label = 17
	.Chart.Level(1).Label = 256
End With
|
|
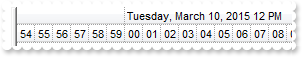
609
|
How can I display weeks
With G2antt1
	.Chart.LevelCount = 2
	.Chart.Level(0).Label = 17
	.Chart.Level(1).Label = "<%ww%>"
End With
|
|
608
|
How can I display days, from 2 to 2
With G2antt1
	.Chart.LevelCount = 2
	.Chart.Level(0).Label = 256
	With .Chart.Level(1)
		.Label = "<%dd%>"
		.Count = 2
	End With
End With
|
|
607
|
How can I display days
With G2antt1
	.Chart.LevelCount = 2
	.Chart.Level(0).Label = 256
	.Chart.Level(1).Label = "<%dd%>"
End With
|
|
606
|
How can I display days
With G2antt1
	.Chart.LevelCount = 2
	.Chart.Level(0).Label = 256
	.Chart.Level(1).Label = 4096
End With
|
|
605
|
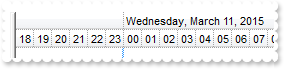
How can I display hours, from 6 to 6
With G2antt1
	.Chart.FirstVisibleDate = "00:00"
	.Chart.LevelCount = 2
	.Chart.Level(0).Label = 4096
	With .Chart.Level(1)
		.Label = "<%hh%>"
		.Count = 6
	End With
End With
|
|
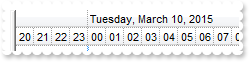
604
|
How can I display hours
With G2antt1
	.Chart.LevelCount = 2
	.Chart.Level(0).Label = 4096
	.Chart.Level(1).Label = "<%hh%>"
End With
|
|
603
|
How can I display hours
With G2antt1
	.Chart.LevelCount = 2
	.Chart.Level(0).Label = 4096
	.Chart.Level(1).Label = 65536
End With
|
|
602
|
How can I display minutes, from 15 to 15
With G2antt1
	.Chart.FirstVisibleDate = "00:00"
	.Chart.LevelCount = 2
	.Chart.Level(0).Label = 65536
	With .Chart.Level(1)
		.Label = "<%nn%>"
		.Count = 15
	End With
End With
|
|
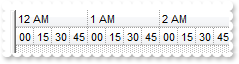
601
|
How can I display minutes
With G2antt1
	.Chart.LevelCount = 2
	.Chart.Level(0).Label = 65536
	.Chart.Level(1).Label = "<%nn%>"
End With
|